
BIM has long been promoted as the central digital representation of a construction project, encompassing everything from geometry to schedules, costs, and specifications. That’s possible, but are there better alternatives?
Even experienced BIM practitioners acknowledge that managing all design and product data within a modeling software is not feasible. Models become huge when trying to manage vast datasets (e.g., all products, lifecycle data) within a single model. Furthermore, BIM modeling software is for expert users, which most in the construction value chain are not.
Consequently, software developers and savvy users have ways to integrate external software and databases. This allows, for example, a contractor to utilize material data from a model in an ERP system for procurement purposes without needing to interact with the model directly. However, these solutions are typically tied to a specific modeling software as extensions, which might not be ideal for everyone.
An open alternative
As companies seek to leverage AI in data management and automation, access to data across the entire construction value network, as well as for operations and maintenance, becomes increasingly critical.
If you don’t want to interact with specific BIM software and heavy models, you have alternatives. Semantic networks, known as knowledge graphs, have emerged as a software-independent approach to storing and manipulating Building Information Modeling (BIM) data. They enable both humans and machines to understand and reason about the connections between the entities.
The term “semantic” refers to the addition of meaning and context to this network. Instead of merely listing components and their attributes, a semantic knowledge graph defines the roles and relationships of these components within the building’s structure. For instance, it doesn’t just record that a particular object is a “door”; it understands that this door connects two specific rooms and is part of a certain wall.
An example
In this imaginary example, I present a part of a large knowledge graph. It includes information about a room that has a light and fan coil unit. One of the room’s walls has two openings, each with a door.
Objects denoting a room, wall, door, etc., are referred to as nodes. The relationships between the nodes are referred to as edges. Nodes can have attributes, like the GTIN codes of the products in this example.
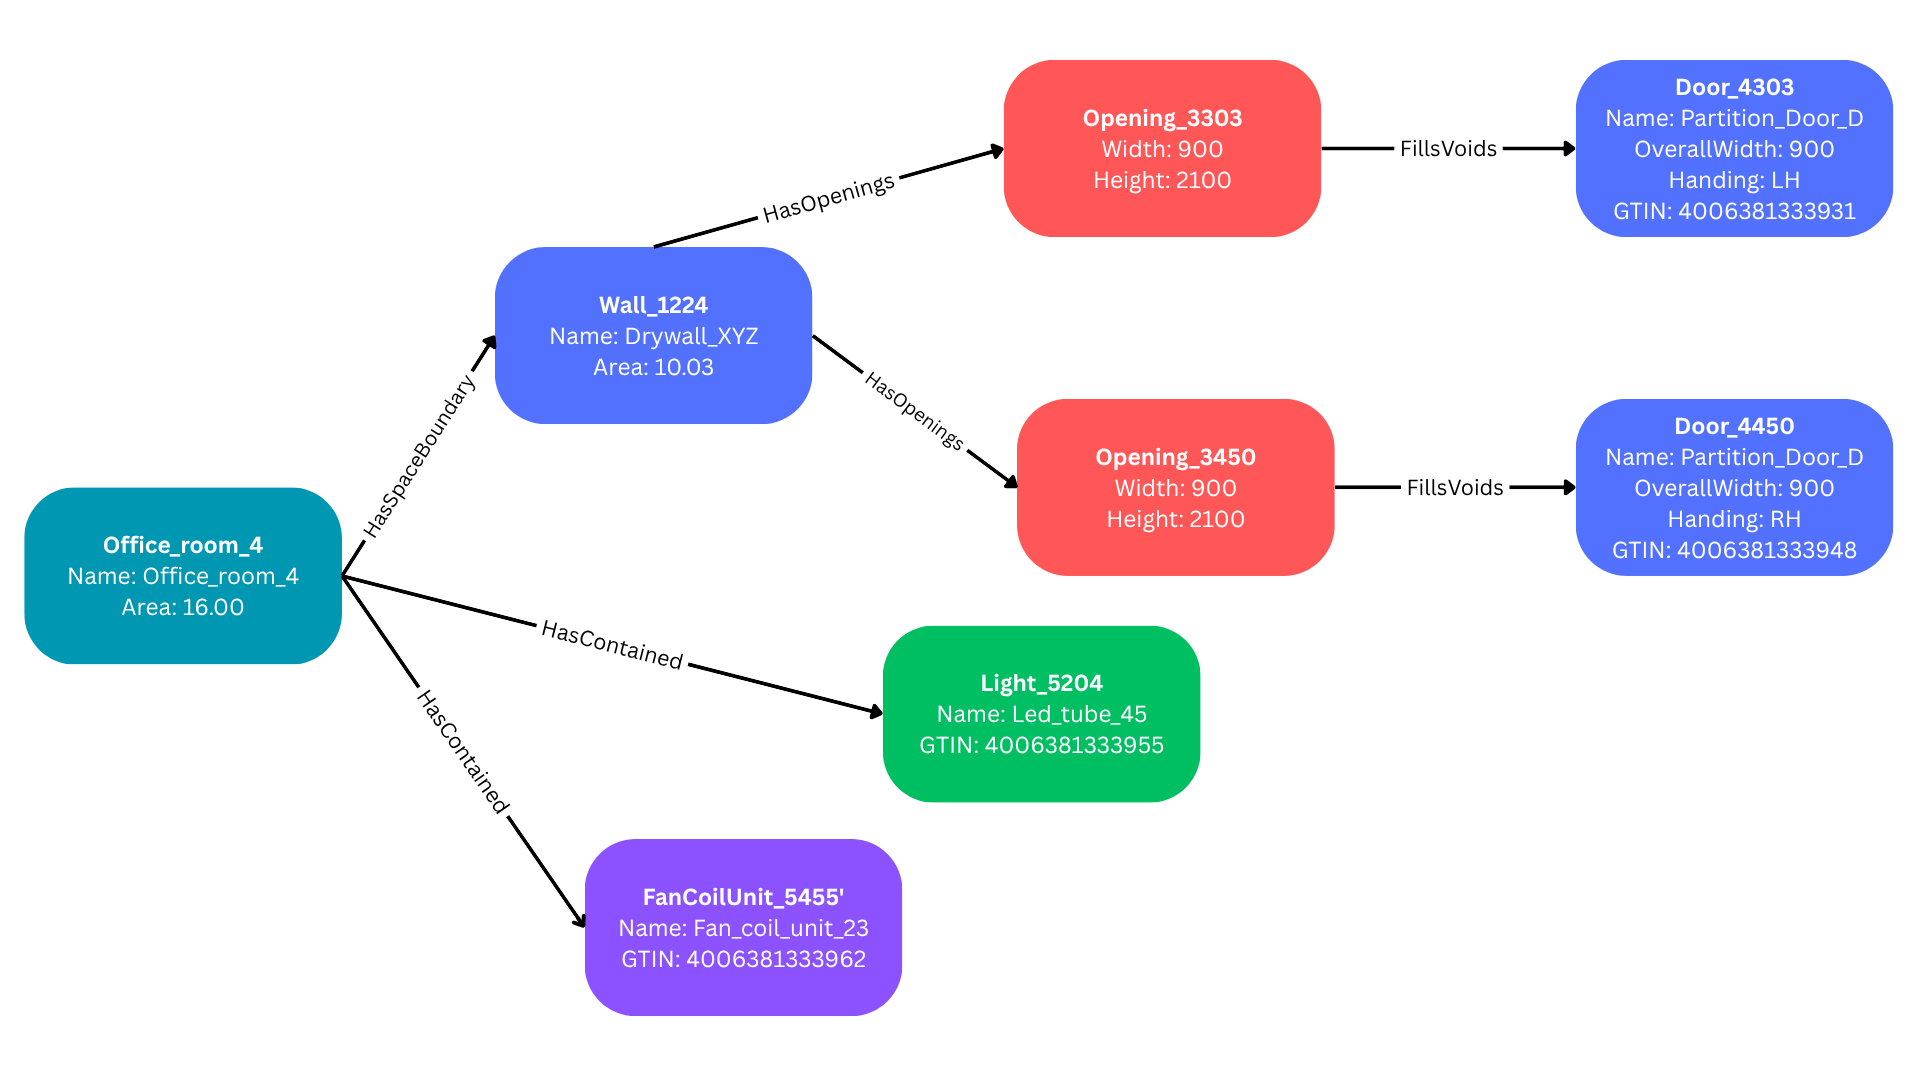
The way information is presented in a knowledge graph is called a triple. Each triple represents a single fact or statement about data, structured into three parts: the subject (a room), the predicate (contains), and the object (a fan coil unit).
You could come up with the types of nodes and edges to use, but specific ontologies already define them. IfcOWL, BOT, OntoBIM, and DiCon are some known examples. These ontologies facilitate interoperability, data integration, and advanced querying across various systems and stages of a building’s lifecycle.
The concept of a namespace is frequently discussed in the context of knowledge graphs. In our previous example, to comply with the IFC standard, we’d denote the doors as ifc:IFCDoor. The ifc prefix refers to the IFC namespace. We can refer to multiple namespaces in the same graph, if necessary.
Using knowledge graphs in construction and maintenance
A knowledge graph can theoretically encompass every piece of information from a BIM model. By omitting the 3D geometric details, the graphs remain manageable in size while still capturing 80% or more of the essential information required for procurement and the owner’s operations and maintenance. There are ways to link to the accurate geometry whenever needed.
You can also link external data sources, like EPDs, price lists, and emission databases, to the knowledge graph. A knowledge graph could become the “digital twin” when linked to maintenance databases and IoT data.
Since the knowledge graph is more than just a table of data, you can make queries like “which rooms have equipment XYZ installed?” or “which components in this building were replaced in the last 5 years?” or “which MEP elements are affected if this wall is demolished?” This technology also enables AI-based reasoning and automation more effectively than traditional databases or spreadsheets.
How to implement
There are software tools available for extracting IFC data or data from native software into a format that is useful for constructing a knowledge graph.
Knowledge graphs can be presented in a text format, but a more efficient solution is to store them in a graph database, such as Neo4j, GraphDB, or Blazegraph. These databases allow for the storage, querying, and analysis of complex relationships within BIM data, facilitating tasks such as facility management, energy analysis, and lifecycle assessment.
There are indications that knowledge graphs will not remain a research topic but will become valuable tools in tomorrow’s real estate and construction industry.
View the original article and our Inspiration here
Leave a Reply